In the last lesson, we looked at debugging, the old school way. There's a better way to debug, but it has some messy setup. Let's check it out.
How many doggos?
Let's take a program from before, with the variable $dogs changed to $doggos. Here's the code.
- <?php
- $doggos = $_GET['dogs'];
- // Compute message, and CSS class.
- $message = '';
- $class = '';
- if ($doggos < 1) {
- $message = "You don't have doggos! Boo! Get doggos!";
- $class = 'argh';
- }
- else if ($doggos = 1) {
- $message = "You have a doggo! That's good, but you need one more.";
- $class = 'fair';
- }
- else if ($doggos == 2) {
- $message = "You have two doggos! That's the perfect number!";
- $class = 'good';
- }
- else {
- $message = "Wow, that's a lot of doggos!";
- $class = 'fair';
- }
- ?><!DOCTYPE html>
- <html lang="en">
- <head>
- <meta charset="UTF-8">
- <title>Dogs</title>
- <meta name="viewport" content="width=device-width, initial-scale=1, shrink-to-fit=no">
- <link rel="stylesheet" href="styles.css">
- </head>
- <body>
- <h1>Dogs</h1>
- <p>Do you have enough dogs?</p>
- <p>Number of dogs: <?= $doggos ?></p>
- <p class="<?= $class ?>"><?= $message ?></p>
- </body>
- </html>
I made one other change, too, as we'll see.
So, I run the program. Here's the GET param:
- something.php?dogs=2
Two dogs. Here's the output:
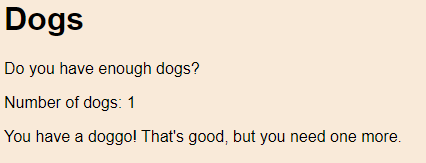
What the f...?? It thinks we have one dog.
Let me try this:
- something.php?dogs=3
I get:

Argh! It's broken!
I read through the code carefully, but I don't see the problem. This is where the debugger can help.
I'll add a breakpoint to the code, just as you would be in VBA, by clicking in the grey area:
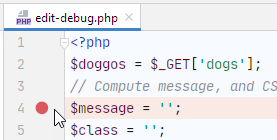
Now, when I run the program, it will stop when it gets to the line. Actually, it will stop just before it runs the line.
I refresh the browser, which runs the program again. PHPStorm stops at the breakpoint, and shows me memory so far. You can see the values of variables.
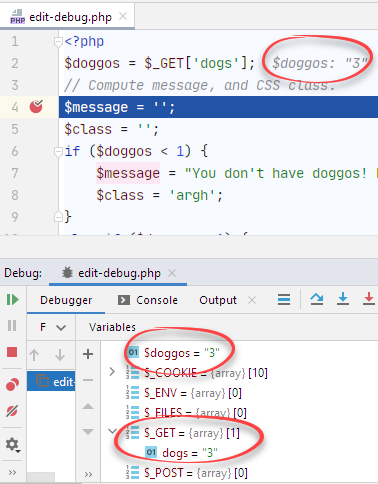
You can see $_GET, and $doggos. What can you tell me about the bug so far?

Adela
Well, $doggos is what we expect. So the problem isn't with line 2.
Right! The variables' values are what we expect, so the problem is after the breakpoint.
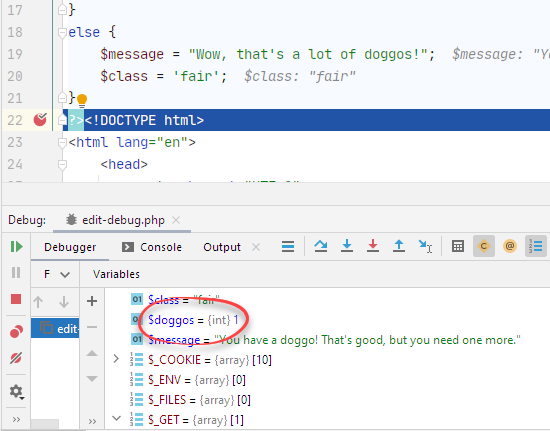
Now I'll add a breakpoint right after the ifs, but before the HTML. Here's what I see:

Ethan
Hey! $doggos is now 1. That's wrong! It should still be 3.
Indeed! Something went wrong between the breakpoints. We've narrowed down the lines that could be wrong.
Single step
OK, I'll run the program again, but when it stops on the first breakpoint, I'm going to single step the code. That is, run just one line at a time. The shortcut key for that is F8, on Windows and Linux.
I get to line 10:
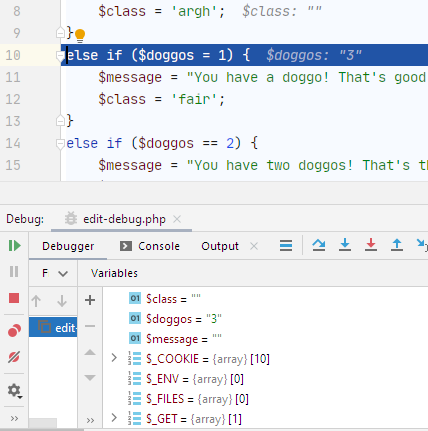
Alright, $doggos is 3, everything is fine. I hit F8, to run line 10. What should happen?

Ray
Well, $doggos is not equal to 1, so it should skip to line 14.
Makes sense. I'll hit F8:
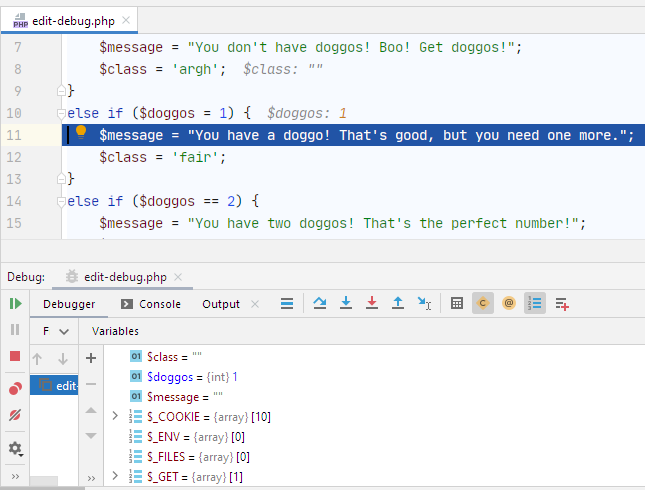
Wait, what?! It's running line 11. And look at $doggos! It has the wrong value!
The program was OK up to line 10, then not. Line 10 is messing things up.

Georgina
Oh, my dude! I see it! Line 10 is supposed to be...
- else if ($doggos == 1) {
... but it's...
- else if ($doggos = 1) {
It's missing an =.

Adela
OMG, Georgina! You rock!

Ethan
Yeah, nice work!

Ray
I don't get it.
== and = are different. == is a test for equality. So $doggos == 1 gives true, or false, depending on whether $doggos is one or not.
= is an assignment statement, like VBA. Put the value on the right, into the variable on the left. $doggos = 1 puts one into $doggos, erasing what was there.

Ray
Oh, I see! Wow, that sucks.
You know, with all the cool stuff PHPStorm does, it should be able to check that.
Hmm. Good point, Ray. Let me dig around a bit... Aha!
PHPStorm has many rules it uses to warn you about possible errors. They're called inspections. There are hundreds of them, and they've saved me time and again.
You can see them under File | Settings | Editor | Inspections. Go to PHP, and scroll down to Probable bugs. Guess what the first one in the list is?
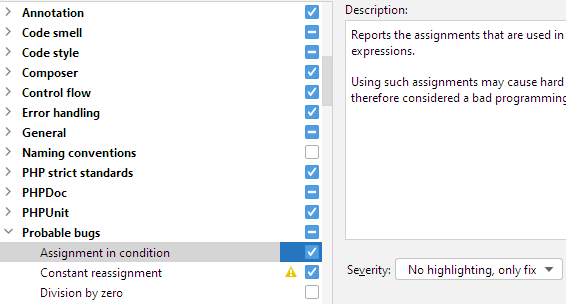
"Assignment in condition" is the bug we saw. Look at what PHPStorm does when it detects that: fix it automatically, without telling you. The problem is, because of the way I edited the code, PHPStorm didn't detect the problem! And I'm not so keen on it editing my code without telling me.
I changed the setting to Warning. This is what I see now:
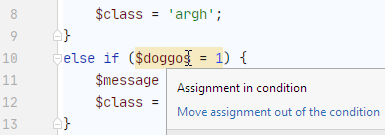
Remember that the yellow background indicates a warning. Just what I want.
PHPStorm rarely gets a setting wrong, but this is a case where it did. In my opinion, anyway.

Adela
That's a freakin' long list of inspections.
Aye, it is. It's one reason PHPStorm is a fave among developers.
Setting up debug
Debugging is a Must Have. PHPStorm uses an external tool: Xdebug. It's the most widely used PHP debugging tool.
The first step is to install XDebug in XAMPP. Let's check whether it's installed already. Start Apache, and go to the XAMPP home page, at localhost, or localhost:8080, or whatevs. There's a link to a page giving you PHP info:
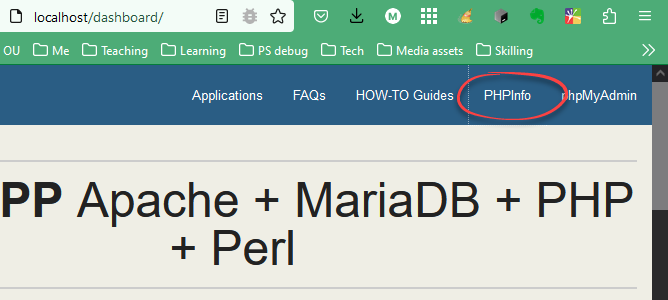
Click it, and you'll see a bunch of info on PHP. Like, a lot.
Alternatively, go to one of these, for whatever port you use for XAMPP:
You'll see config info about PHP.

Adela
So, this a URL on localhost, so the file dashboard/phpinfo.php should be on my PC, right?
Aye! Good thinking, Adela! Let me look for the file... there it is!

It has this in it:
- <?php phpinfo();
phpinfo() that makes HTML to show the deets of your PHP installation. You can use it yourself, whenever you want.
Let's check for XDebug. At the bottom of the first box, there's this:
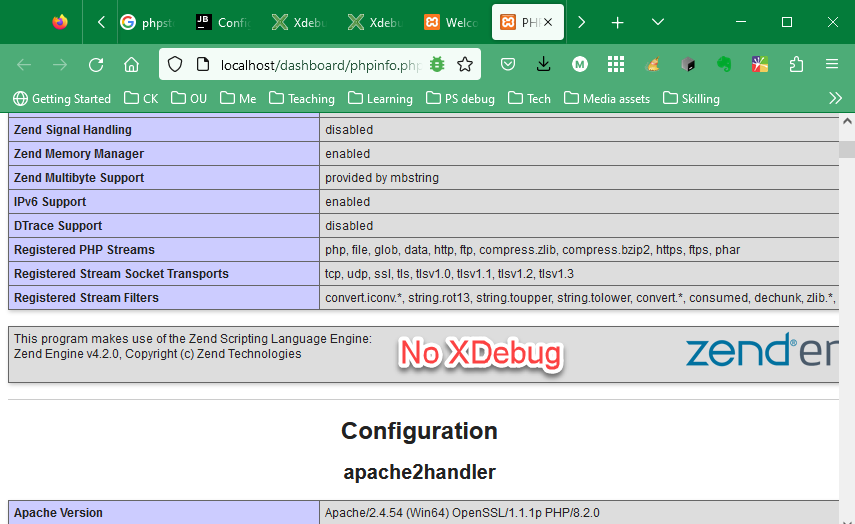
No reference to XDebug there, so we have to install it.
The easiest way is to use the XDebug wizard, at https://xdebug.org/wizard. It will show you a text box...
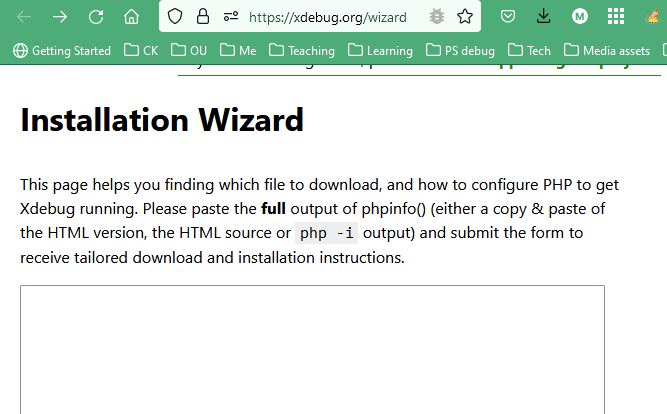
... and ask you to paste in your server's PHP info. So, go back to the PHP info page, Ctrl+A to highlight everything, copy, and paste into the textbox. Click the analyze button.
You'll get some instructions. I got:
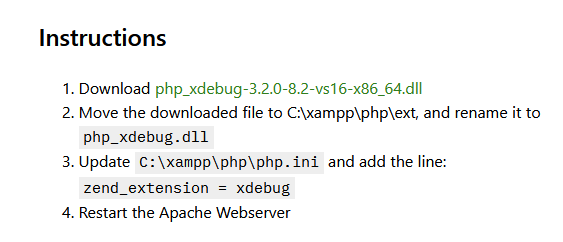
I did what it said. To restart Apache, click the Stop button in the XAMPP control panel, wait a second, then click Start again.
Go back to the PHP info page, and refresh.
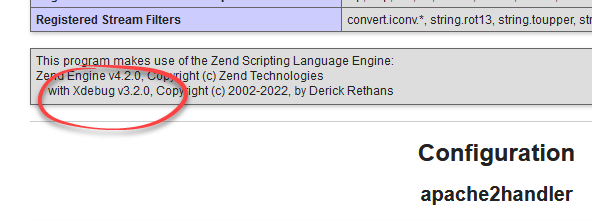
W00t!
Into the storm, again
PHPStorm can check whether debugging is set up correctly. There's an item in the Run menu:
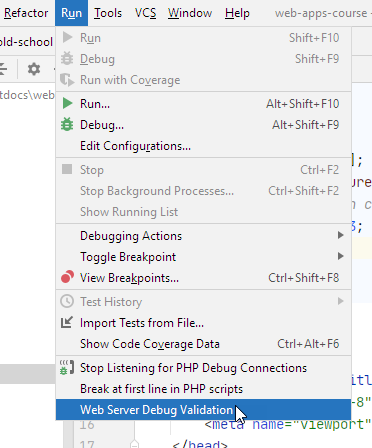
You'll see something like this:
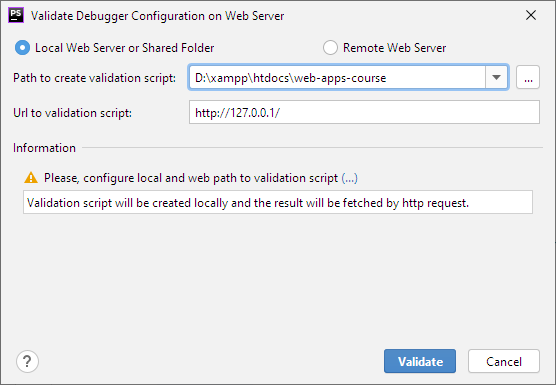
What this tool does is:
- Write a special PHP program to your hard drive, using a file path.
- Run the program, using a URL.
- Check the output, to see whether the debugger is running.
Remember that a URL like localhost/test.php is really a path to a file, like D:\xampp\htdocs\test.php. So the tool might:
- Write
test.phptoD:\xampp\htdocs. - Go to
localhost/test.phpto run the program. - Check the output.
You need to pick a folder on your local site that PHPStorm can write its test program to. For example, I decided to keep it simple, and have PHPStorm use the root of localhost.
So, I needed to tell PHPStorm file path and URL of localhost's web root:
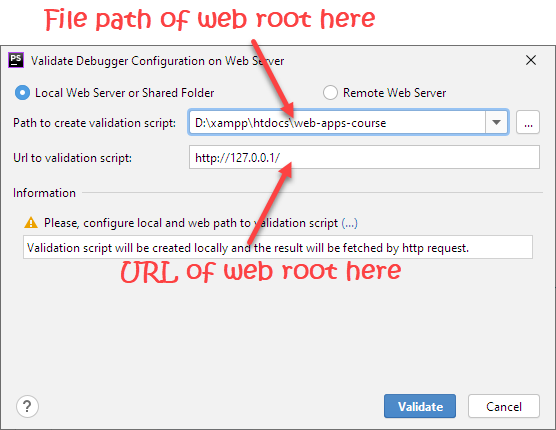
OK, if you remember, I used port 8080 for my server, so I needed to add that to the URL.So the root of my website is http://127.0.0.1:8080. You won't need to add that, if you used port 80.
BTW, localhost and 127.0.0.1 are the same.
I installed XAMPP in D:\xampp, so the file root of my local site is at D:\xampp\htdocs.
I filled those two things in,

and clicked the Validate button. It said I needed to add something to php.ini:
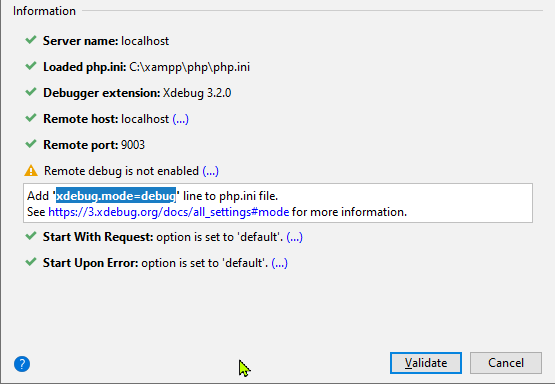
So, I did that. You can see the path to the php.ini file in the screenshot.
Here are the three lines I added to php.ini:
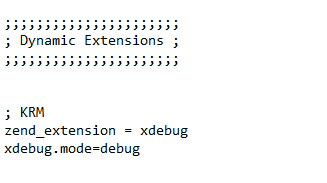
I added the new lines around line 890, but you can put them anywhere, AFAIK. The ; KRM is a comment with my initials, in case I need to quickly find the lines again.
Then I restarted Apache, and clicked Validate again:
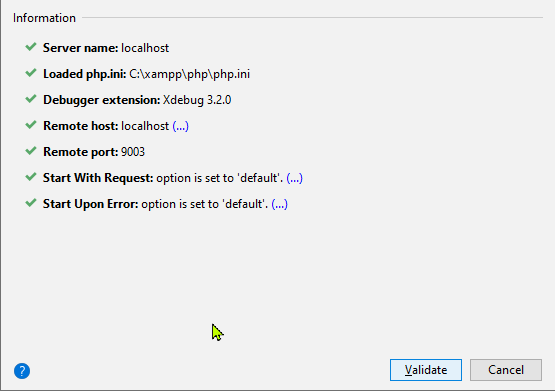
W00f!
Last step, to add browser extensions to link your browser to XDebug in PHPStorm.
On Chrome, I added the Xedug helper (this link may not work - search the webstore for Xdebug). It adds an icon to your browser. Click it to enable/disable debugging.
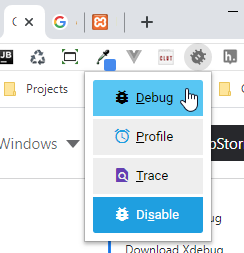
Firefox has a similar extension.
The debug listener
In PHPStorm, debugging will work only if the debug connection listener is on:
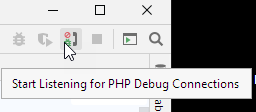
Now you should be able to add breakpoints in PHPStorm.
If you have trouble, check Debug with PhpStorm: Ultimate Guide.
Unwanted breaking
Sometimes I have trouble with PHPStorm breaking when I don't want it to. If that happens to you, check under File | Settings | Languages & Frameworks | PHP | Debug. Here are my settings:
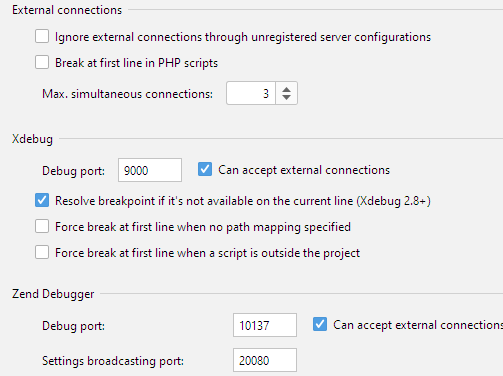
Does it work?
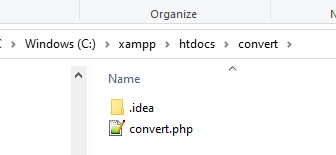
To test it, I put a simple PHP program in a folder where XAMPPP could serve it. I made a folder called convert in htdocs, and put the program there. It converts centimeters to inches, but it doesn't really matter what it does.
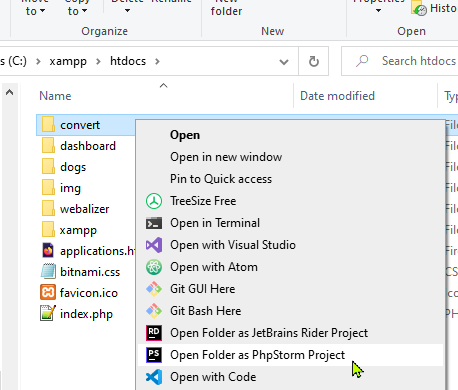
Then I popped up a level to htdocs, right-clicked on the convert folder, and opened it as a PHPStorm project:
I added a breakpoint on a line of PHP, and told PHPStorm to listen for debug connections.
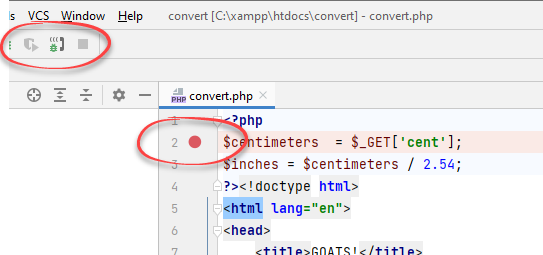
I went back to the browser, and pointed it at localhost/convert/convert.php. PHPStorm jumped in, and stopped at the breakpoint.
Victory!
Exercise
Set up debugging
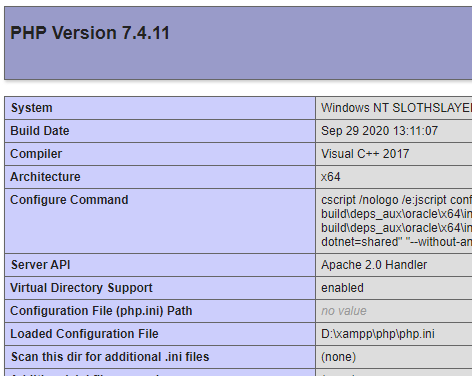
Prove that you've set up debugging in your IDE. Include the following screen shots.
Show your PHP info, with the location of your php.ini file. For example:
Code in your IDE, stopped at a breakpoint, showing variable values. For example:

This screenshot must show the value of at least one variable, like the 11 on line 4. Use this code, if you like:
- <?php
- // Debugging test.
- $message = 'Doggos are the best!';
- $rating = 11;
- ?><!DOCTYPE html>
- <html lang="en">
- <head>
- <meta charset="UTF-8">
- <title>Dogs</title>
- <meta name="viewport" content="width=device-width, initial-scale=1, shrink-to-fit=no">
- <link rel="stylesheet" href="styles.css">
- </head>
- <body>
- <h1>Dogs</h1>
- <p><?= $message ?></p>
- <p>Rating: <?= $rating ?> out of 10</p>
- </body>
- </html>
Up next
Let's continue learning PHP.